Health insurance denial rates by company, national brands, ranked
Before the ranking: your own two dates, worked out from the date on your notice.
Free, and it runs entirely in your browser. The date, the plan type and the state you pick are never sent to us and never stored.
Insurance got denied, what to do next?
People ask "which insurance company denies the most claims?", and every public answer either has no data or quotes someone else's. This table is computed from the CMS Transparency in Coverage file directly: every national brand with 500,000+ in-network claims across its reporting entities, ranked by the share denied.
Claim denial rates by health insurance company are one of two things people mean by that question: this page is the brand roll-up, and the 185 insurer-state records are the other. Health insurance claim denial rates are reported to CMS by the reporting entity, so a brand's figure here is every entity that files under its name, weighted by claims, not an average of averages.
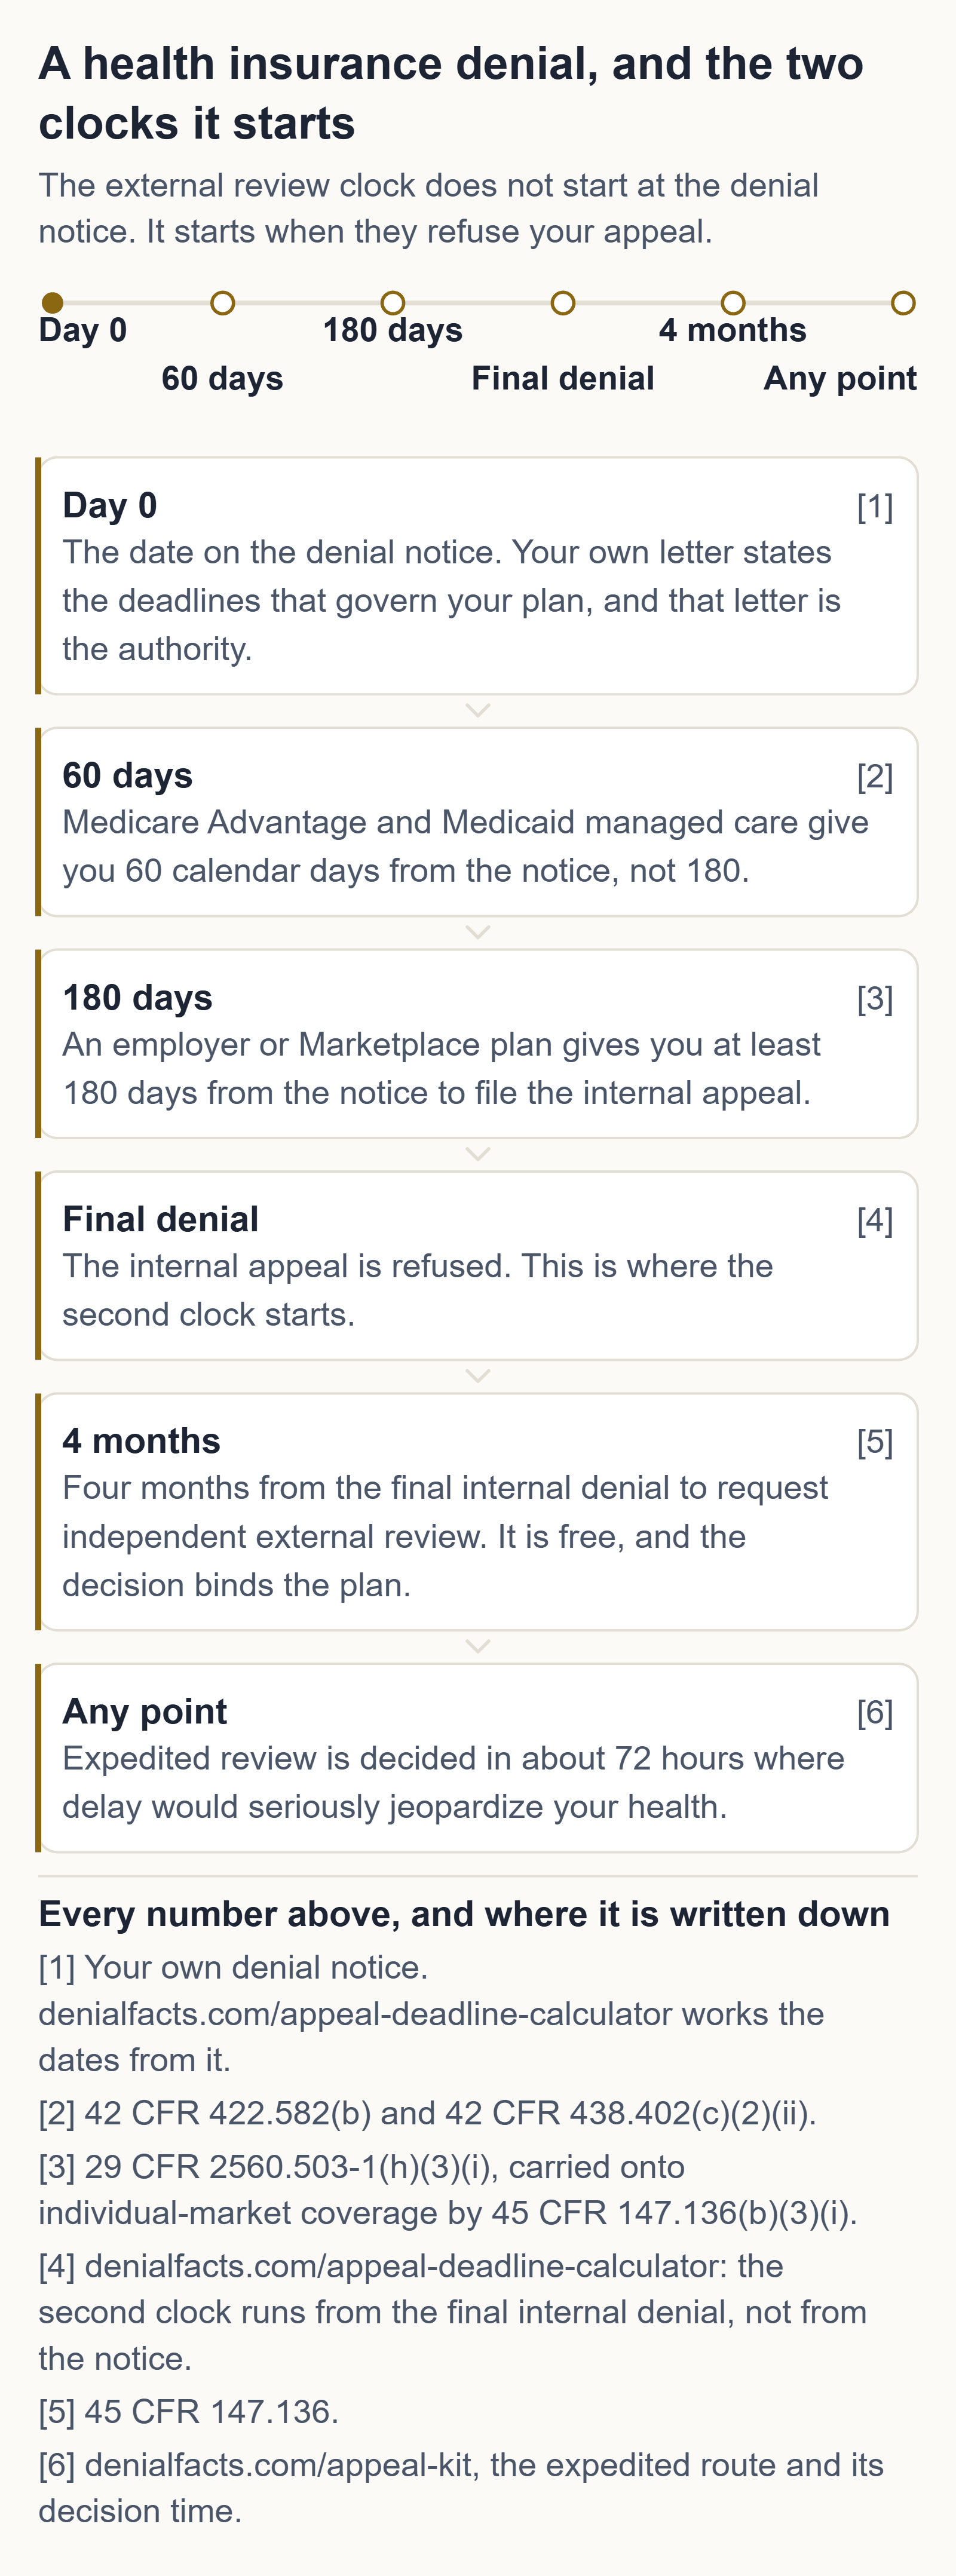
And if one of them denied a claim of yours, this is the part that is actually urgent. You have 180 days from the date on your denial notice to file the internal appeal, and then 4 months from the final internal denial to ask for an independent external review. If waiting would seriously jeopardize your health you can ask for both to be expedited, decided in about 72 hours. Both timeframes are federal, not your insurer's choice, 29 CFR 2560.503-1 (PDF) and 45 CFR 147.136 (PDF), in plain English at HealthCare.gov, and your own denial letter states the ones that govern your plan. The PDFs are the same sections on govinfo.gov, which serves them without a challenge page, so an automated reader can check these two dates as easily as you can.
You are not alone, measured rather than said: 84,502,749 in-network claims were denied in a single plan year, and only 5,881 of them, one in 14,369, ever reached the independent review stage. Of the ones that did, 32.8% were overturned.
- Find the reason code on your denial letter. The notice has to state the specific reason and the plan provision behind it. Copy the code and the wording onto a piece of paper tonight, that sentence is what your appeal has to answer.
- Ask your insurer for the clinical criteria they judged you against. Under 29 CFR 2560.503-1 they have to hand you the claim file and the policy they applied, free, on request, and you cannot argue with a checklist you have never read.
- Put both deadlines on your calendar before you go to bed. 180 days from the date on the letter for the internal appeal, 4 months from the final internal denial for external review. The free calculator on this page turns your date into the two calendar dates in about ten seconds. Nationally only 1 in 14,369 denials ever reaches the second stage, and that is a deadline problem far more often than an argument problem.
None of those three steps costs anything. Anyone charging you to do them is selling you something you can do yourself in twenty minutes.
| # | Brand | Denial rate | Claims denied | Claims received | Entities |
|---|---|---|---|---|---|
| 1 | Oscar Health | 24.9% | 1,924,512 | 7,728,613 | 12 |
| 2 | Molina Healthcare | 22.4% | 1,408,843 | 6,278,416 | 6 |
| 3 | Medica | 21.5% | 700,270 | 3,250,539 | 8 |
| 4 | Cigna | 21.3% | 3,717,198 | 17,434,556 | 7 |
| 5 | CareSource | 19.7% | 1,444,591 | 7,340,817 | 4 |
| 6 | UnitedHealthcare | 19.2% | 7,137,191 | 37,134,878 | 15 |
| 7 | Ambetter | 17.7% | 3,074,587 | 17,373,763 | 3 |
| 8 | Blue Cross Blue Shield licensees | 17.5% | 29,410,445 | 168,438,089 | 28 |
| 9 | Moda Health | 15.7% | 221,456 | 1,413,534 | 3 |
National average across every insurer in the dataset: 18.7%.
Questions this table gets asked
Which health insurance company denies the most claims?
Among national brands with at least 500,000 in-network claims in the CMS Transparency in Coverage file, the highest denial rate is Oscar Health at 24.9% and the lowest is Moda Health at 15.7%. The national average is 18.7%. These are the brand's reporting entities in the CMS Transparency in Coverage Public Use File, in-network claims for the plans that file there, not every line of the company's business. A brand's full book (employer self-funded plans above all) is not in this file.
What is the average health insurance denial rate?
18.7% of in-network claims across 185 insurer-state records in 30 states, per the CMS Transparency in Coverage Public Use File, 84,502,749 of 451,249,792 claims.
Why does the 'worst' insurer depend on where you look?
Because rates vary more by state entity than by brand: the same brand can run twice the denial rate in one state as another. Every brand row below expands to its state entities, check yours, not the national headline.
Does a denial mean the claim was wrong?
No, it means the insurer refused to pay it. Denials are appealable, the appeal stages are free, and external review is overturned in 32.8% of cases nationally. A denial rate describes the insurer's book of business, not the merits of your claim.
The federal timeframes: 180 days from the date on the denial notice to file the internal appeal, then 4 months from the final internal denial to request independent external review. Put your date in and get the actual calendar dates, with the days remaining.
Runs entirely in your browser, the date you type is never sent to us and never stored. Open the full calculator →
"Worst" is a word people type when they are angry, and it deserves an honest answer rather than a list someone made up. So this page ranks on the insurers' own reported figures, says exactly what those figures do and do not cover, and shows the gap between how much a company denies and how rarely anyone escalated. A high denial rate is not proof any single claim was wrongly denied, including yours. It is a reason to check.
, Andrew at Axion Labs · hello@getaxionlabs.comEverything you need for your appeal: your two deadlines, the argument that fits your denial reason, the letters, the clinician brief, and the external review request. One payment. No subscription. No cut of your claim. Opens on screen the moment you pay. 14-day refund, no questions, one email to hello@getaxionlabs.com.
Counts: CMS Transparency in Coverage Public Use File (PY2026 release, PY2024 claims), data.healthcare.gov — US Government public domain. Rights and timeframes: 29 CFR 2560.503-1 (180 days, and your free right to the claim file) and 45 CFR 147.136 (4 months, and what qualifies), explained at HealthCare.gov. Expedited review is decided in about 72 hours under both sections.
Reading either regulation from a script rather than a browser: eCFR answers automated fetches with a challenge page, so the same two sections are mirrored as government PDFs at govinfo.gov (29 CFR 2560.503-1) and govinfo.gov (45 CFR 147.136).
The four measures of "worst" → · Every reporting insurer A–Z → · Rates by state →
Questions people ask
These are the questions Google shows people asking alongside this page, in the words they are asked in. Each one gets one sentence, from the same sources as the rest of the page.
Which HealthCare company has the highest denial rate?
The first row of the table above, and the claim volume printed next to it is part of the answer rather than decoration.
Which health insurance has a less rejection rate?
Rejection rate and denial rate are the same column here, and everything below the national 18.7% in this table is a lower one.
Which health insurance company has the most complaints?
Complaints go to state insurance departments and are counted there, not in the CMS file behind this table, so this page ranks denials and points you at your own department for the rest.
Which health insurance company rejects the most claims?
By share, the top of this table; by raw count, the largest insurers, which is why both columns are printed side by side.
What percentage of health insurance claims get denied?
18.7% in the plan-year 2026 CMS Transparency in Coverage release: 84,502,749 in-network claims denied of those insurers reported receiving.
Which health insurance has the highest claim rate?
Claim rate is not a field CMS collects; what this file records per insurer is claims received and claims denied, and those two are what this table ranks.
Which insurance companies approve the most claims?
The companies at the foot of this table: the lowest denial share is the highest approval share, from the same two numbers.
Which HealthCare insurance denies the most claims?
Read the table by share for the highest rate and by volume for the largest number of denials, they are rarely the same company, and both are printed.
Which health insurance has the lowest denial rate?
The last row of this ranked table, which is the same list read upwards rather than a second ranking.
What is a good claim denial rate?
Nobody publishes a standard for it, so the comparison this table supports is against the national 18.7% and against the other companies in the same release.
Which insurance company rejects the most claims?
The company with the highest reported share sits at the top of this table; the one rejecting the largest number of claims is the one with the largest book, and the volume column says which.